Running ads is one thing. Knowing whether they’re working is another.
As a traffic manager, understanding campaign metrics is essential. These numbers tell you what’s going right, what needs fixing, and where to focus your time and budget.
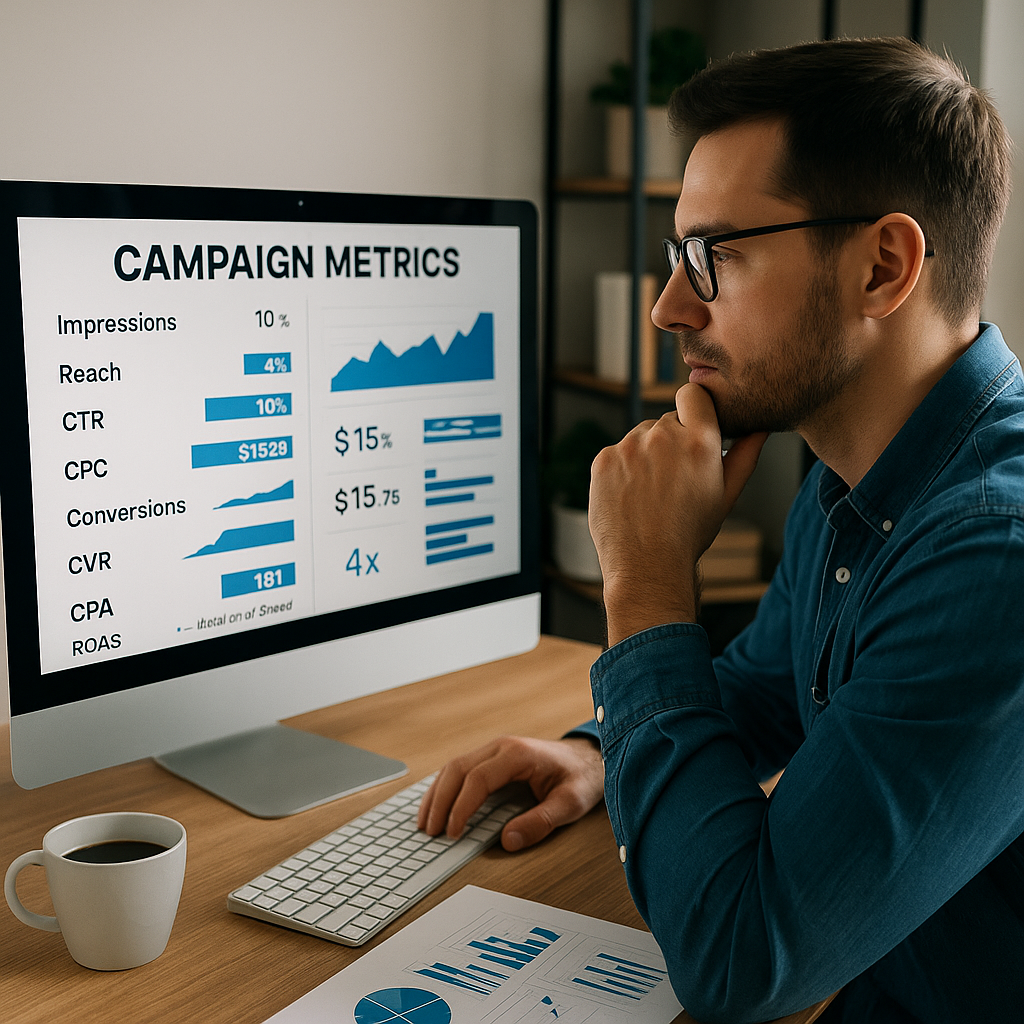
If you’re just starting out, the dashboards of platforms like Meta Ads or Google Ads can feel overwhelming. But once you learn how to interpret the key metrics, they become your greatest tool for optimization.
In this article, you’ll learn the most important metrics every traffic manager should monitor — what they mean, why they matter, and how to use them to improve results.
Why Campaign Metrics Matter
Metrics help you:
- Identify what’s working
- Spot underperforming ads
- Improve return on ad spend (ROAS)
- Communicate clearly with clients or stakeholders
- Make data-driven decisions — not guesses
In short: metrics are your roadmap.
Key Traffic Campaign Metrics (Explained Simply)
Let’s break down the most important metrics across platforms like Facebook Ads and Google Ads.
1. Impressions
What it is:
The number of times your ad was displayed to users.
Why it matters:
Shows reach and visibility. High impressions with low clicks may mean your ad isn’t engaging enough.
2. Reach
What it is:
The number of unique users who saw your ad.
Why it matters:
Helps determine how many people you’re exposing to your offer. A high reach with low conversions may suggest targeting issues.
3. CTR (Click-Through Rate)
What it is:
The percentage of people who saw your ad and clicked it.
Formula: Clicks ÷ Impressions × 100
Why it matters:
Indicates how relevant and engaging your ad is.
🔹 A good CTR is generally 1% or higher for Facebook, 3–5% for Google Search.
Low CTR = Poor ad creative, weak CTA, or wrong audience.
4. CPC (Cost Per Click)
What it is:
The average amount you pay per click.
Why it matters:
Tells you how much it costs to bring a visitor to your page.
High CPC = inefficient spending or high competition in your niche.
Lowering CPC:
- Improve CTR
- Use more relevant keywords or audience segments
- Improve ad Quality Score (Google)
5. CPM (Cost Per 1,000 Impressions)
What it is:
How much you pay for every 1,000 ad views.
Why it matters:
Helps compare costs across campaigns focused on reach or brand awareness.
High CPM = your audience might be expensive, or your ad quality is low.
6. Conversions
What it is:
The number of desired actions taken (e.g., purchases, form submissions, sign-ups).
Why it matters:
Conversions are the ultimate goal of most campaigns. You need conversion tracking set up properly (Meta Pixel or Google Tag).
7. CVR (Conversion Rate)
What it is:
The percentage of clicks that resulted in conversions.
Formula: Conversions ÷ Clicks × 100
Why it matters:
Tells you how effective your landing page or funnel is.
Low CVR =
- Weak landing page
- Poor offer alignment
- Slow site speed
- Bad audience targeting
8. CPA (Cost Per Acquisition)
What it is:
How much you paid for each conversion (lead or sale).
Why it matters:
The most important metric for profitability. You want CPA to be lower than your average revenue per customer.
High CPA? Optimize your creatives, audience, and landing page.
9. ROAS (Return on Ad Spend)
What it is:
Revenue earned ÷ Ad spend.
Example: If you spent $100 and made $400, ROAS = 4x
Why it matters:
ROAS shows whether your campaign is profitable.
A ROAS below 1 means you’re losing money.
10. Frequency (Meta Ads only)
What it is:
The average number of times a person saw your ad.
Why it matters:
High frequency (above 3–4) = ad fatigue. Users may start ignoring or getting annoyed.
Try refreshing the creative or changing the audience.
How to Use Metrics to Improve Campaigns
🔍 Example 1: Low CTR
Fix the creative — make it more eye-catching or rewrite the headline.
🔍 Example 2: High CTR, Low Conversions
- Check if the landing page matches the ad
- Improve the offer
- Test different CTAs
🔍 Example 3: High CPC and Low CTR
- Narrow your targeting
- Improve relevance
- Use stronger images and hooks
🔍 Example 4: High Conversions, High CPA
- Try manual bidding
- Optimize for value actions
- Focus on lookalike audiences
Tools to Help You Monitor Metrics
- Meta Ads Manager (Facebook/Instagram)
- Google Ads Dashboard
- Google Analytics (GA4)
- Looker Studio (Google Data Studio) for custom reports
- Ubersuggest or SEMrush for competitive insights
- Google Tag Manager for tracking events
What Metrics to Show Clients
If you manage traffic for others, keep reports clear and focused. Avoid overwhelming them.
Include:
- Total spend
- Clicks and CTR
- Cost per result (lead, sale)
- Conversions
- ROAS (if applicable)
- Visual charts for trends
Use tools like Google Sheets or Canva to format simple, branded reports.
Final Thoughts: Data Is Power
As a traffic manager, numbers aren’t just numbers — they’re actionable insights.
When you learn to read your metrics like a pro, you’ll:
- Save money
- Make smarter decisions
- Improve results
- Build client trust
- Scale campaigns with confidence
Mastering metrics transforms you from a button-clicker into a strategic marketing partner. And that’s where the real value lies.